Traffic Impact Analysis
Evaluating a traffic impact analysis on your transportation network for new developments is easy with PTV Vistro. Why? Vistro’s integrated workflows allow you to generate, distribute, and assign project trips quickly. Moreover, our on-screen graphics allow you to see problems fast and easily test and alleviate traffic with Vistro’s mitigation tools.
Vistro’s scenario manager makes it easy for you to analyze any number of future scenarios. This powerful tool enables you to evaluate the influences of project trips over time, such as with horizon years. Also, this tool facilitates the exploration of staged build-outs of developments or sub-areas of mixed land uses across multiple projects. Also, Vistro’s “fair-share analysis” tool allocates the mitigation-project costs based on the number of relative trips generated by various projects.
Do you have last-minute changes to the project description? Or, do you need to test alternative land uses? PTV Vistro’s integrated workflow makes changes to the trip generation and resulting assignments a snap! The following guides the development of your transportation impact analysis or traffic impact analysis (TIA) studies using PTV Vistro.
For more information, check out Traffic Impact Analysis and Studies from the Training Web Series with a Video tutorial, example files, and Q&A.
Creating Project Trips
PTV Vistro’s trip generation accommodates ITE and custom trip generation rates, as well as direct trip entries. Also, Vistro’s trip generation calculations reflect both added or removed trips, resulting in accurate evaluations of redevelopment sites. Distribution and assignment of trips are completely under the analyst’s control. This creates maximum flexibility for assignments throughout the network, including project driveways. Moreover, PTV Vistro’s robust traffic impact analysis workflows account for internal trip capture, pass-by, and diverted trips.
Vistro has three network TIA elements – Zone, Gates, and Paths – to add development trips to your network. Also, three TIA Workflow tables – Trip Generation, Trip Distribution, and Trip Assignment build up traffic impact analysis scenarios.
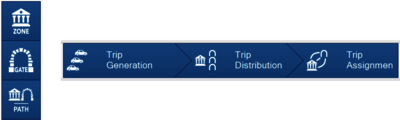
Zones, Gate, and Paths
In Vistro, a Zone represents a source of new trips to the network. Typically, a Zone represents the addition of a single land use (e.g., retail, housing, etc.). However, aggregating multiple land uses into a customized super zone is possible for a larger traffic impact analysis.
Gates represent as gateways in your network. This is where new trips begin (for inbound trips to Zones), or where trips end (for outbound trips from Zones). Typically, place Gates at the edges of your study area network; however, gates can be placed within your study area, as needed.
Paths are directional objects connecting Zones and Gates. Typically, after completing the Trip Distribution workflow table, Paths on the Trip Assignment Workflow can be automatically generated. However, they can be drawn manually or modified. Multiple Paths may be defined between each Zone-Gate pair. This provides the user with ultimate flexibility in defining the assignment of new project trips on the network.
Trip Generation
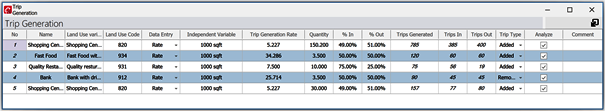
After placing a Zone, enter or edit development information in the Trip Generation workflow table. This table consists of land use type, quantity, trip generation rate, the percent in and out.
One trip generation method utilizes the Trip Rate and Quantity often calculated from the ITE Trip Generation Manual. This is a standard resource determining trips for a traffic impact analysis. The “Rate” data entry option, calculates trips based on the land use "Quantity"; for example, how many 1,000 square-feet or how many dwelling units. This "Quantity" is multiplied by the trip generation "Rate"; for example, trips/1,000 square-feet, or trips/dwelling unit, etc. Additionally, this result is multiplied by the inbound and outbound trip percentages. It is possible to copy and paste the Trip Generation table data to a spreadsheet for further analysis or modifications.
Another trip generation method is to use the trip values directly. You can select the “Trips” data entry option, enabling direct entry of the number of inbound and outbound trips. Notably, this method can be useful when the trip generation has already been calculated from an external source. A common source is the ITE Trip Generation Manual.
Vistro generates positive or negative trips utilizing the “added” or “removed” trip type. Importantly, this adds flexibility for your traffic impact analysis. When a traffic impact analysis consists of existing site redevelopment utilize the “removed” option. Redevelopment potentially influences the base traffic count volumes. In this special case, two Zones create the trip generation. One Zone removes the existing site's background traffic and the second Zone provides the new development's trip generation.
Note: It is possible to yield a negative "Net Site Trip". If a negative Net Site Trip Volume is greater than the base input volume, a negative Total Analysis Volume is possible; however, Vistro will display 0 volume.
ITE TripGen Web App API
PTV Group is an authorized partner of ITE to user the API to the ITE TripGen web-app. This API requires internet access. Users of this API must own a single-user licenses to the ITE TripGen web-app and have internet access.
To access the API, in the upper right corner of the Trip Generation workflow, there is a link indicating the ITE TripGen web-app API log-in status. Click it to login (see the video above for more information). To access the API’s Vistro Dialog, click on the ‘Edit’ link in each zone’s data row or right-click on each data row to open the context menu.
After opening the Vistro ITE Trip Gen App API dialog, complete the form from top to bottom using ITE look up data to return your Trip Generation result from the ITE Trip Gen App. Parameters for this dialog can be found in the ITE Trip Gen App help on ITE’s website. The API will return parameters available for each land use as the user goes through the form.
When the form is completed, click the Calculate button. Select either the trips generated by the method by using the radio buttons. When clicking ‘OK’ data from your method selection will automatically be transferred to the Vistro Trip Generation table for the zone’s trip generation. Vistro will automatically select the ‘Rate’ Data Type if Average Rate method is used or select ‘Trips’ if the Fitted Curve method is used. All data from the Vistro ITE Trip Gen API dialog will transfer.
‘Data Plots and Equation’ can be reviewed to see the sample size, equation, R2 value, and data scatter plot points. This information will open in your default web browser. Additionally, the land-use description can be reviewed with the ‘Click for Description and Data Plots’ link.
Distributing project trips
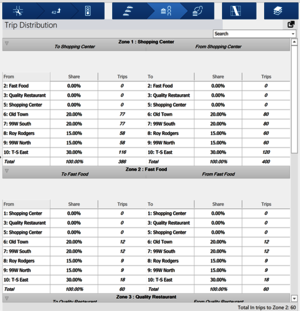
The Trip Distribution workflow table allocates the new Zone trip percentage (inbound/outbound) across all Gates.
These distributions are entered as “share” percentages for both inbound (“to” the Zone) and outbound (“from” the Zone). Distribution values can be determined from various sources, such as field measurements (origin-destination studies), derivations from existing traffic volumes, or larger demand models (PTV Visum). It is recommended that the selected methods conform to the reviewing agency’s policies or a documented agreement is reached.
Assigning project trip
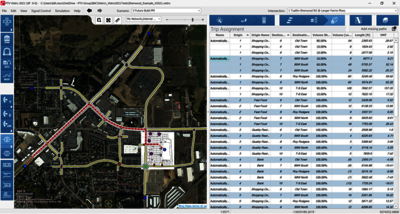
A Trip assignment refers to roadway choice, or Path, that trips take between Zones and Gates for the traffic impact analysis. Additionally, Paths are established automatically in the Trip Assignment workflow or drawn manually.
Automatic Path Generation
Generally, it is the easiest to click the “Add Missing Paths” button in the Trip Assignment workflow table. This results in creating Zone-Gate connections via the shortest path method. Additionally, each row of the Trip Assignment table indicates the trip volumes assigned to each path. These volumes are dynamically based on the trips being generated and distributed in your traffic impact analysis. Importantly, PTV Vistro’s dynamic connection across the Trip Generation and Distribution workflows facilitate instantaneous updates.
Automatically generated Paths respect closed or restricted turns. This is indicated by an intersection’s lane configurations and the direction of a one-way street.
Manual Path Generation
When you click on the row in the table, a red-colored Path is visible in the network. If a new Path is drawn, it will be grouped in the table with the Path(s) sharing the same Zone-Gate pairs (directionally). The Volume Share cell customizes the percentage of trips between the Zone and Gate use by a specific path. Moreover, if the directional paths do not add up to 100%, Vistro’s will show a red color in these cells. And, this adds quality control functionality to our traffic impact analysis.
Create Reverse Paths of the manual path is simple. Right-click on any manual path to open the context menu and select “Create Reverse Path”. Vistro automatically creates the reverse direction of that path. However, the Path percentage, “Volume Share” requires updating in the Traffic Assignment workflow to ensure a sum equals 100%.
Note 1: Drawing a Path manually will respect the direction of a one-way street. However, it will not exclude closed or restricted movements due to regulatory signs or geometrical constraints. This includes examples like restricted U-turn or right-in/right-out driveway. These movements could have trips assigned to them utilizing the manual adjustment. Please verify these cases carefully and update the Path accordingly.
Note 2: Reversing a Path that is assigned to a one-way street creates a path in the wrong direction. Please verify these cases carefully and update the Path manually.
Modifying a Path
Modifying paths in PTV Vistro is easy. Within the trip assignment table, select a path to modify. Once a path is selected it is shown on the network with a dark red Path. Next, all Paths can be modified quickly by hovering the mouse over a Path. Then, once the Path changes to a brighter shade of red, hold the left-mouse click at any point along the Path. Then drag the Path to a new street. To set the Path, release the mouse button.
When modifying a path, intersections can be locked temporarily at single or multiple locations between the Zones and the Gates. To lock a single intersection, select a Path, then hover over the intersection grip you wish to lock. When left-clicking on the intersection, move to either the upstream or downstream side of the Path. Note the color change to a brighter red color when moving. The brighter red section of the Path will be modified with a mouse drag. Also, the darker red section will remain locked. To lock multiple locations, while the Path is selected, left-click on any intersection between the Zone and Gate. When moving off the intersection, the push-pin color turns red, indicating that the intersection is locked.
Tip: Modified Paths use the direction of travel. When modifying a Path, drag it to the correct side of the roadway based on the direction of travel. This may help reduce U-Turns or around the block maneuvers.
Note 1: Manually modified Path logic will exclude the wrong direction down a one-way street. But, this does not exclude closed or restricted movements due to regulatory signs or geometrical constraints. This includes examples like restricted U-turn or right-in/right-out driveway. These movements could have trips assigned to them utilizing the manual adjustment. Please verify these cases carefully and update the Path accordingly.
Note 2: To add an intersection after Paths are created, right-click on an existing leg. This action opens the context menu. Next, select the insert intersection option to retain paths using that leg. As needed, extend an existing leg to help a new intersection's insertion. Unjoining legs from an intersection and/or snapping legs to a new intersection containing Paths will result in Path deletion.
Vehicle-Miles Traveled
Additionally, on the Trip Assignment Workflow PTV Vistro’s detailed trip assignment table automatically calculates VMT calculations for new project trips. Moreover, this table calculated Vehicle-Kilometers Traveled (VKT) when metric units are used. This traffic impact analysis information is useful for agencies now requiring VMTs as part of their reports.
Adjustment to project trips
Pass-by Trips
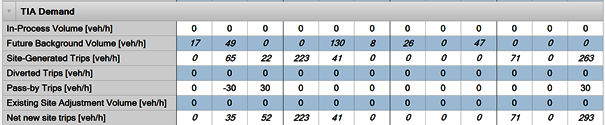
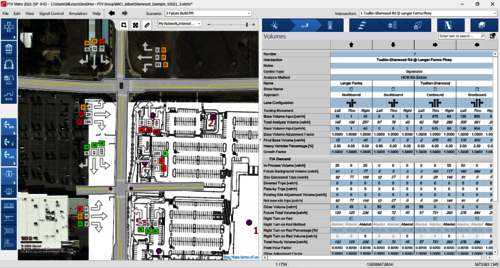
PTV Vistro can also account for pass-by trips in a traffic impact analysis. These are represented in the Volumes workflow table. Pass-by trips are existing trips making an intermediate stop at a development site. Then, these trips continue onto a destination, as originally planned. For example, think of how a new gas (petrol) station attracts trips already existing on the roadway. These trips are not considered “new” to the network.
When a development utilizes a Pass-by trip analysis, be sure that Vistro's trip generation information only includes, “new”, non-pass-by trips. These new trips are considered additional volume assigned throughout the study network. Pass-by Trips fields are located in the Volumes workflow table, Utilize this field to make your pass-by trip adjustments to your project "driveway".
For example, a gas station located on the right side of the road may have 30 “pass-bys”. This means that 30 trips from the existing background traffic are entering a new gas station as a right-turn movement, thus the Pass-by Trips for the right-turn is 30. Also, Pass-by trips for the through is -30 because 30 existing trips are entering the gas station. Moreover, to complete the adjustment, these trips must resume to the original destination; therefore 30 Pass-by trips assigned to the right turn exiting the gas station.
Diverted Trips
Vistro can also account for diverted trips in a traffic impact analysis. Diverted trips are adjacent facilities without direct access to the site, yet continue to the original destination. These trips are assigned in the same manner as pass-by trips. Vistro accounts for these trips in the Diverted Trips cells in the Volumes workflow table.
Other Adjustments
Vistro can also account for other trips added nearby in a traffic impact analysis. If you need to account for nearby trips from other sites (not already reflected in your background counts), you can enter these in the “In-Process Volume” field in the Volumes workflow table. Alternatively, creating Zones estimate the trip assignments from the other developments.
Additionally, PTV Vistro includes an “Existing Site Adjustment” field and an “Other” Volume field to provide custom adjustments to your network.
Scenario Management
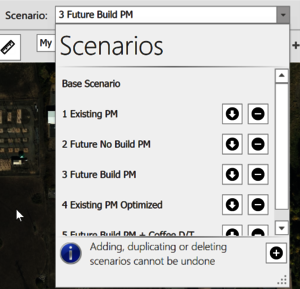
PTV Vistro’s scenario manager allows you to model limitless scenarios for your traffic impact analysis. New developments require several scenarios to evaluate transportation impacts and operating conditions. These include different times-of-day, years, seasons, existing conditions, and project conditions. Moreover, Scenario Manager easily enables you to evaluate phased projects and sensitivity testing in one file.
To access scenarios, simply use the Scenarios pull-down menu. Here, add, duplicate, or delete scenarios for your analysis. The Base Scenario is a special-case scenario, where network changes will apply to all other scenarios (unless already modified).
Modeling tips for Zones, Gates, and Paths with Scenario Management
Each traffic impact analysis is different. However, it is recommended that you add your Zones, Gates, and Paths in the Base Scenario. Also, trip generation information can be entered. This makes these objects available in every scenario in your file. Importantly, turn off Zone impacts in your existing scenarios in the Trip Generation workflow. Here, utilize the "Analyze" checkbox for each zone. Then, in a specific scenario, Zones can be check to "Analyze". This is useful for staged-development build-outs. Also, you can make Trip Generations updates modify/delete paths in each scenario.
Note: To add an intersection after Paths are created, right-click on an existing leg. This action opens the context menu. Next, select the insert intersection option to retain paths using that leg. As needed, extend an existing leg to help a new intersection's insertion. Unjoining legs from an intersection and/or snapping legs to a new intersection containing Paths will result in Path deletion.
Visualization of new project trips
Trips assigned in Vistro can be seen in numerous places. In the Volumes workflow table, the TIA Demand sub-table lists many components of TIAs. This includes Site-Generated Trips – which are those assigned in Vistro. These are part of the Net New Site Trips. These trips are visualized utilizing the Show Turning Movements in the network window. Also, Vistro’s reports contain these volumes in many of the tables and figures.
Figures
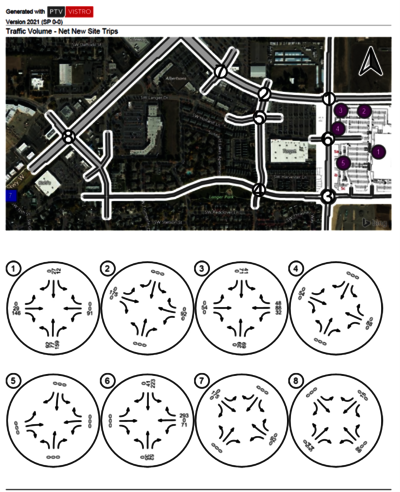
One of the many options for Vistro’s preconfigured figures is displaying new site trips.
Fair-share analysis
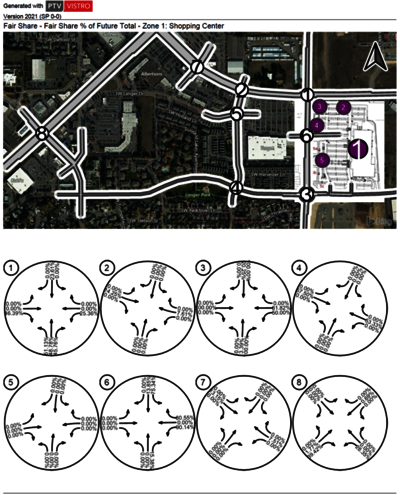
Vistro tracks trip assignments at every turning movement in your network, for each zone. This makes it easy to determine the number of trips added for any given zone in your network - and at any given turn. Vistro reports fair-share values in tables and figures in the Vistro report. Reports are showing these for trips or percentages by Zone, based on new traffic or all traffic – in both tabular and graphical format. Using these reports, it is easy to identify the portion of trips being added by each Zone at every turning movement in the network.
Mitigations
Quickly test different mitigation measures or tests using PTV Vistro’s mitigation tool in the Mitigation workflow table. This tool keeps a record of potential mitigations for each intersection per scenario. Also, Vistro’s scenario manager provides flexibility to test multiple intersections mitigations.
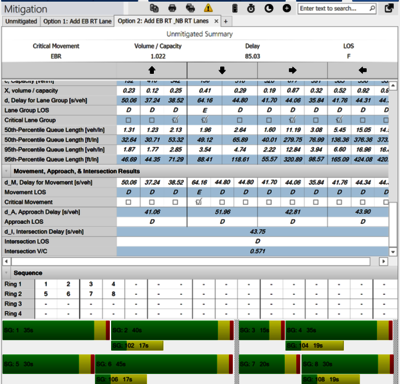
Creating a mitigation
In the Mitigation workflow table, the “Unmitigated” tab represents a condensed version of your current analysis inputs and results. You don't want to make mitigations here, as that will update the original intersection. By clicking the “+” right of the tab, Vistro will create a new mitigation “Option”. Mitigation operations are easily compared to the "Unmitigated" values shown at the top of the table.
Clicking the "+" button again creates additional "Options" by copying the unmitigated condition. Clicking the Duplicate icon in the upper bar duplicates the active mitigation. Importantly, this enables you to make new experiments and keep documentation of every decision - all in one file.
The print icons in the upper toolbar of print results from either individual or all mitigations. Mitigation measures will not be reflected in the standard Vistro reports or the on-screen graphics.
Creating a mitigation scenario
To create a mitigation scenario, simply duplicate a scenario and rename it (e.g., “Future PM – with Mitigations”). Then, modifications can be made directly in the Intersection Set-up or Traffic Control workflow tables. This method is advantageous when mitigating multiple intersections concurrently, such as retime traffic signal corridors or reroute traffic. Utilizing this method displays results in the standard Vistro reports and the on-screen graphics.