Automate and Customize your Traffic Analysis Report
We know that your traffic signal optimization projects and traffic impact studies are centered around a lot of data and results. And to prevent data overload, we understand that you need an all-inclusive reporting tool that can provide the precise scale of information required for your deliverable or check document.
Developed by experienced traffic engineers and planners like you, PTV Vistro’s reporting tool provides you with a selectable mixture of carefully crafted and customized operational summaries, traffic figures, and full-page details, all at a push of a button. With this information, you can quickly predict capacity, density, speed, delay and queuing on a variety of transportation facilities.
Your style, your report
With PTV Vistro, we give you the flexibility to enter your project details and company logo into the report headers and footers with a simple drag. We even enable you to customize the starting page number, so your PTV Vistro report can continue right after the main study document.
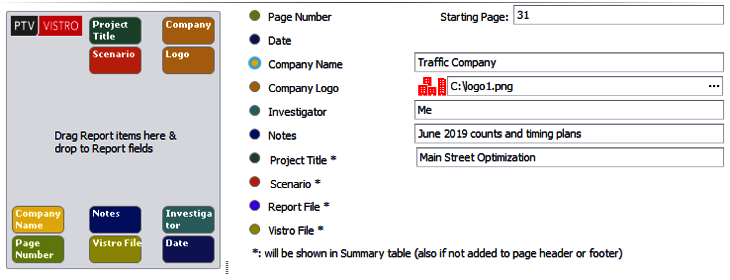
Report customization options
Table of Contents
When you save your PTV Vistro report into a PDF format, the optional table-of-contents page contains linkable sections. To help navigation further, additional bookmarks are added to the PDF.
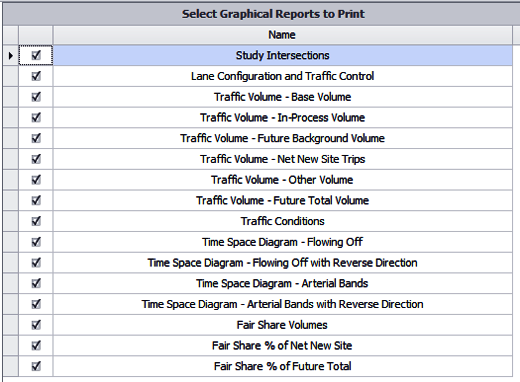
Next, you can tailor the scope of your PTV Vistro report by selecting the tables or figures that are right for you. On the Reporting tab layout, additional filtering by selecting the necessary intersection(s), trip generation zone data, or signal coordination route(s) will customize your report further.
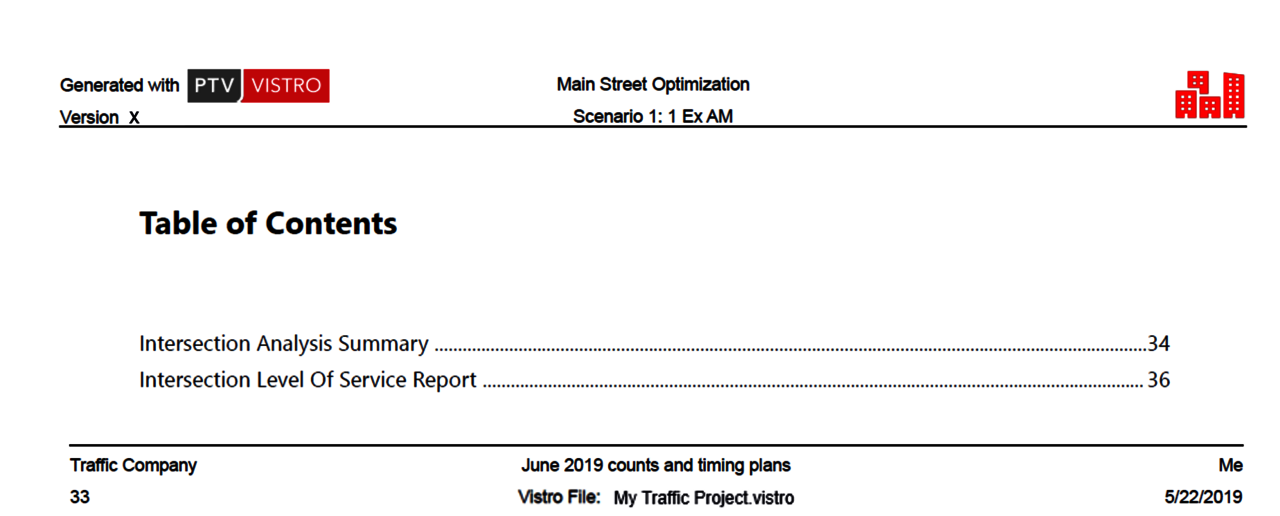
Report table-of-contents with custom header, footer, and company logo
Time saving traffic figures
To help visually communicate your project data, PTV Vistro automatically incorporates critical traffic figures and site maps required for your TIA study. These automated graphics make the creation and rechecking of post-processed figures obsolete, resulting in large savings to your project budget.
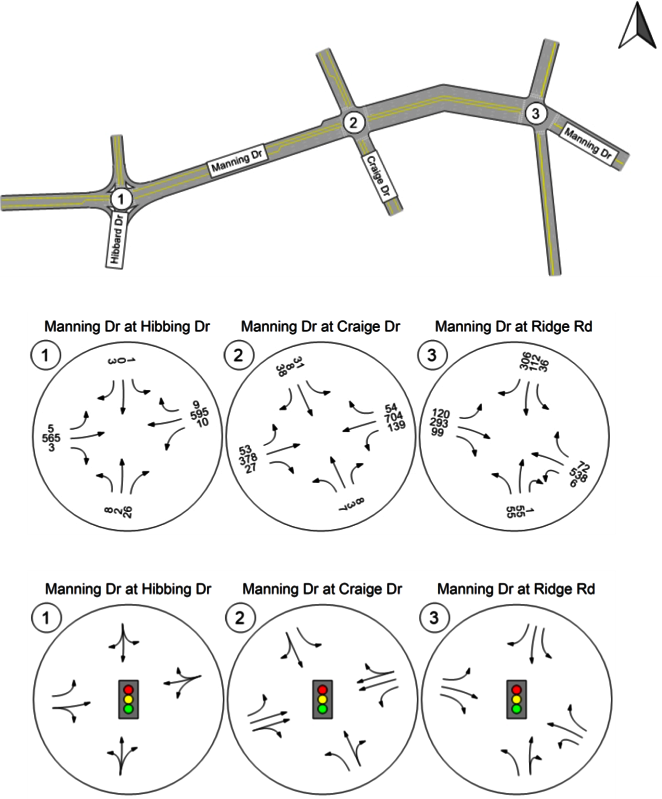
In addition to helping your project’s deliverable, these traffic figures can be an integral addition to your project’s quality control process. Graphics can be printed and used to easily verify various data entries.
For added flexibility, report figures can be printed in an HTML format for easy integration with project web sites or to access the figures’ native graphic files.
Traffic figures include lane configurations, traffic control settings, traffic volume data, operational results, time-space diagram elements, and calculated TIA fair-share data
Tabular reports for detailed analyses
PTV Vistro provides a collection of analysis summaries and detailed report tables for selected intersections, which conform to the Highway Capacity Manual, the Canadian Capacity Guide, and the ITE Trip Generation formats. These tables, such as the Intersection Analysis Summary include overviews of intersection level of service, delay, worst movement, and volume-to-capacity ratios.
Traffic Signal Timing and Calculations
Detailed reports include relevant parameters, calculated values, and elements such as traffic signal timing and phases for traffic controller setup. In the Intersection Level of Service Reports, PTV Vistro provides traffic signal field technicians the right information to input optimized timing patterns into the traffic controller, including cycle lengths, vehicle and pedestrian phase splits and numbering, min and max greens, vehicle and pedestrian clearance intervals, and detector settings.
TIA summaries and calculations
For TIA projects, PTV Vistro tabular reports provide summaries and detailed calculations at a selected zone’s Trip Generation, Trip Assignment, Trip Distribution, and Fair-Share Analyses. “Who pays for that left-turn lane?” PTV Vistro’s Fair-share analyses provides you with a breakdown each development zone’s contribution of new site traffic at each intersection per lane group. Therefore, you will know how to distribute mitigation costs across developments within your project area.
Print your mitigations
Do you need a record of the countless mitigations and tests that you perform? PTV Vistro provides an Intersection Level of Service Report printing option in Mitigation mode to document the conceptual designs’ or optional signal timing plans’ impacts.
Traffic signal warrants
Need to determine if you need a new traffic signal at your existing or proposed intersection, with or without development traffic? Using the Traffic Signal Warrants tool, PTV Vistro will calculate the eight-, four-, and peak-hour traffic signal warrants for you using the methods prescribed in the FHWA MUTCD.
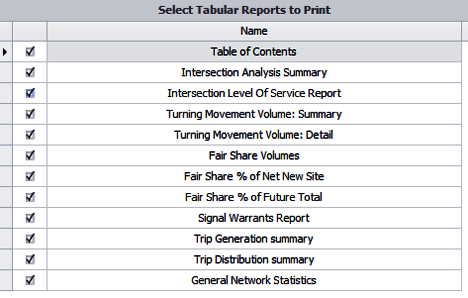
Tabular summaries and detailed information include intersection analysis, volume information, and fair-share, trip generation, and distribution calculation reports
Your All-in-one reporting tool
PTV Vistro is centered around improving your workflow – and with the smart and friendly Reporting tools, you can produce consistent high-quality figures and report tables that meet your study requirements at a click of a button. The custom visual and analytical outputs provide you with the right amount of details at the right time and enhance the way you translate data, so you can easily find the best solution that fits your objectives.